%20--%3e%3csvg%20width='63.297821mm'%20height='39.29665mm'%20viewBox='0%200%2063.297821%2039.29665'%20version='1.1'%20id='svg8765'%20inkscape:version='1.1%20(c4e8f9ed74,%202021-05-24)'%20sodipodi:docname='OBALogoSingle2.svg'%20xmlns:inkscape='http://www.inkscape.org/namespaces/inkscape'%20xmlns:sodipodi='http://sodipodi.sourceforge.net/DTD/sodipodi-0.dtd'%20xmlns='http://www.w3.org/2000/svg'%20xmlns:svg='http://www.w3.org/2000/svg'%3e%3csodipodi:namedview%20id='namedview8767'%20pagecolor='%23ffffff'%20bordercolor='%23666666'%20borderopacity='1.0'%20inkscape:pageshadow='2'%20inkscape:pageopacity='0.0'%20inkscape:pagecheckerboard='0'%20inkscape:document-units='mm'%20showgrid='false'%20fit-margin-top='0'%20fit-margin-left='0'%20fit-margin-right='0'%20fit-margin-bottom='0'%20inkscape:zoom='1.1759259'%20inkscape:cx='179.85827'%20inkscape:cy='102.04724'%20inkscape:window-width='1920'%20inkscape:window-height='972'%20inkscape:window-x='0'%20inkscape:window-y='27'%20inkscape:window-maximized='1'%20inkscape:current-layer='layer1'%20/%3e%3cdefs%20id='defs8762'%20/%3e%3cg%20inkscape:label='Layer%201'%20inkscape:groupmode='layer'%20id='layer1'%20transform='translate(-31.351095,-50.101677)'%3e%3cpath%20style='fill:none;stroke:%233584e4;stroke-width:3.965;stroke-linecap:square;stroke-linejoin:round;stroke-miterlimit:4;stroke-dasharray:none;stroke-opacity:1'%20d='m%2077.07508,77.78787%2014.84134,8.87817%20V%2052.83397%20L%2034.08359,86.5521%20V%2053.69366%20l%2015.27351,9.31107'%20id='path8388'%20sodipodi:nodetypes='cccccc'%20/%3e%3c/g%3e%3c/svg%3e)
How to Use a Stock Screener: A Beginner's Guide
Compare the best free stock screeners for 2026: UK & US tools with real-time data, custom filters, and how to build screens that find the right stocks.
On this page (16)
If you've ever tried to find a promising stock by scrolling through financial news or scanning endless lists of tickers, you already know how overwhelming it can be. A stock screener changes that entirely. Rather than hunting manually, a screener lets you define exactly what you're looking for — revenue growth, low debt, high trading volume, specific price ranges — and instantly filters thousands of stocks down to a manageable shortlist. Whether you're a long-term investor building a portfolio or an active trader looking for short-term setups, knowing how to use a stock screener effectively is one of the most practical skills you can develop. This guide walks through what stock screeners actually do, which free tools are worth your time, and how to build filters that match your investing style.
What Is a Stock Screener and How Does It Work?
A stock screener is a filtering tool that searches a database of publicly traded stocks based on criteria you set. Think of it like an advanced search engine, but instead of web pages, it's searching through financial data points — earnings per share, market capitalization, price-to-earnings ratios, moving averages, dividend yields, and dozens of other metrics.
Most screeners work in two broad categories:
- Fundamental screeners filter based on financial health and valuation metrics — things like revenue growth, profit margins, debt-to-equity ratios, and return on equity.
- Technical screeners filter based on price action and chart patterns — things like stocks trading above their 50-day moving average, RSI levels, or recent volume spikes.
Some platforms combine both, giving you the flexibility to layer fundamental and technical filters together. The output is a list of stocks that meet every condition you've set — your screened universe — which you can then research further before making any decisions.
The Best Free Stock Screeners Available Today
You don't need to spend money to access a capable stock screener. Several platforms offer robust free tiers that are more than sufficient for most investors. Here's a look at the most widely used options:
Openbook
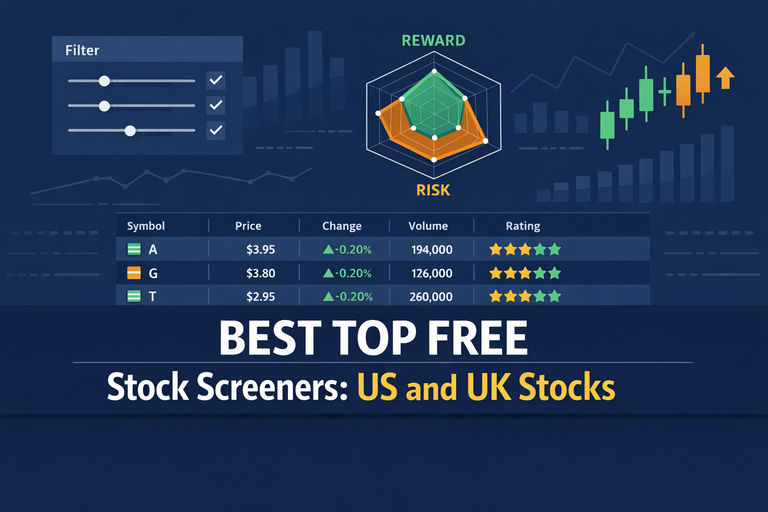
Openbook's own free stock screener is built specifically for UK and US shares, and takes a different approach from the raw-data tools below: every company is scored out of 100 for Reward and Risk, so you can read the quality of a shortlist at a glance instead of interpreting a wall of ratios. The free plan lets you filter by Reward score, Risk score, P/E, market cap and sector across both markets, switch between stocks and ETFs, and it does not expire. For a full walkthrough of what you can screen for free — including step-by-step example screens — see the guide to Openbook's free UK & US stock screener.
Finviz
Finviz is one of the most popular free stock screeners available. Its interface is dense but powerful, offering over 60 filters covering fundamentals, technicals, and descriptive data like sector, industry, and country. The visual heat maps and chart previews make it easy to get a quick read on the market. The free version has a slight data delay, but for most screening purposes, that's a minor limitation.
Yahoo Finance Stock Screener
Yahoo Finance offers a straightforward screener that's well-suited to beginners. It covers the basics — market cap, P/E ratio, price change, and analyst ratings — and integrates seamlessly with the rest of Yahoo Finance's news and data ecosystem. It's not the most powerful tool available, but it's accessible and requires no account to use.
TradingView Stock Screener
TradingView's screener is particularly strong for technical traders. It connects directly to TradingView's charting tools, so you can move from a screened result straight into a detailed chart with a single click. The free tier supports a solid range of filters, and the platform covers equities across global markets, not just US stocks.
Zacks Stock Screener
Zacks is well known for its proprietary earnings estimate data, and its screener reflects that strength. The free version gives you access to Zacks Rank filters, which are based on earnings estimate revisions — a factor with a documented track record in academic research. If earnings momentum is part of your strategy, Zacks is worth exploring.
FINRA's Market Data Center
Less glamorous but genuinely useful, FINRA's tools provide clean, reliable data on trading activity, short interest, and bond markets. It's not a traditional screener, but it fills gaps that other platforms miss — particularly around fixed income and OTC markets.
How to Use a Stock Screener: Building Your First Screen
Opening a screener for the first time can feel like staring at a cockpit — there are a lot of dials. The key is to start with a clear investment thesis and build your filters around it, rather than adding filters at random.
Here's a simple framework to follow:
- Step 1 — Define your goal. Are you looking for undervalued dividend stocks? High-growth small caps? Momentum plays? Your goal determines which metrics matter.
- Step 2 — Set universe filters first. Start broad. Filter by market cap range, exchange, and sector before touching any financial metrics. This narrows the field without over-constraining it.
- Step 3 — Add 2 to 4 core filters. Resist the urge to add 20 filters at once. A screen with too many conditions often returns zero results or a list so small it's not meaningful. Start with your most important criteria and see what comes back.
- Step 4 — Review and refine. If your screen returns 500 stocks, tighten one or two filters. If it returns 3, loosen them. Aim for a list of 15 to 40 stocks that you can then research individually.
- Step 5 — Treat results as a starting point, not a finish line. A screener tells you which stocks meet your criteria on paper. It doesn't tell you whether those stocks are actually good investments. The results are a research shortlist, not a buy list.
Useful Screening Strategies for Different Investor Types
Different investing approaches call for different screening setups. Here are a few common strategies and the filters that tend to support them:
Value Investing Screen
Value investors look for stocks trading below their intrinsic worth. A basic value screen might include a low price-to-earnings ratio (under 15), a price-to-book ratio below 1.5, positive free cash flow, and a debt-to-equity ratio under 1. This type of screen often surfaces companies in cyclical industries or those going through temporary headwinds — which is exactly where value investors tend to look.
Growth Investing Screen
Growth investors prioritize companies expanding their revenue and earnings at above-average rates. A growth screen might filter for year-over-year revenue growth above 15%, earnings growth above 20%, and a return on equity above 15%. Companies like Nvidia (NVDA) and Amazon (AMZN) would have appeared on aggressive growth screens during their high-expansion phases, though past performance in a screen doesn't predict future results.
Dividend Income Screen
Income-focused investors often screen for dividend yield above 3%, a payout ratio below 60% (to ensure the dividend is sustainable), and consistent dividend growth over five or more years. Adding a filter for low debt levels helps identify companies with the financial stability to maintain payouts through economic downturns.
Momentum and Day Trading Screens
Active traders and day traders use screeners very differently from long-term investors. Rather than fundamentals, they focus on price action and volume. Common filters include stocks with unusually high volume relative to their 30-day average, price movements above a certain percentage threshold within the day or week, and technical signals like a breakout above a key moving average. Platforms like Finviz and TradingView are particularly well-suited to this type of screening because of their real-time or near-real-time data and integrated charting.
Common Mistakes to Avoid When Using Stock Screeners
Stock screeners are powerful, but they're easy to misuse. Here are the pitfalls that trip up investors most often:
- Over-filtering. Adding too many conditions creates a screen that's so specific it only confirms what you already believe. This is sometimes called "data mining" — finding patterns that fit a predetermined conclusion rather than discovering genuine opportunities.
- Ignoring context. A stock with a low P/E ratio might look cheap on a screener, but the low valuation could reflect serious underlying problems — declining revenue, management issues, or structural industry challenges. Screeners surface numbers; they don't explain them.
- Treating screener results as recommendations. A screener is a filter, not an analyst. Every stock that passes your screen still requires individual research before you can form a view on it.
- Using stale data. Free screeners often have data delays. For long-term fundamental screening, a 15-minute delay is irrelevant. For intraday trading, it can be the difference between a good entry and a bad one. Know the data latency of the tool you're using.
- Neglecting qualitative factors. Screeners can't tell you about management quality, competitive moats, regulatory risks, or industry disruption. These factors matter enormously and require reading beyond the numbers.
Conclusion: Screeners Are a Starting Point, Not a Shortcut
A well-built stock screen is one of the most efficient ways to narrow a universe of thousands of stocks down to a focused research list. Free tools like Finviz, TradingView, and Yahoo Finance give individual investors access to the same filtering capabilities that professionals use — without the enterprise price tag. But the real value of a screener comes from how you use it after the results appear. The stocks that pass your filters are candidates for deeper analysis, not automatic additions to a portfolio. Pair your screening work with thorough fundamental research, an understanding of the broader market environment, and a clear sense of your own risk tolerance, and you'll have a genuinely useful process — not just a list of tickers.
If you want to put this into practice on UK and US shares, start with Openbook's free stock screener to build your shortlist, then use the stock comparison tool to weigh the strongest candidates side by side.
You can Compare NVDA, AMZN side by side on Openbook, or find stocks with the screener.