%20--%3e%3csvg%20width='63.297821mm'%20height='39.29665mm'%20viewBox='0%200%2063.297821%2039.29665'%20version='1.1'%20id='svg8765'%20inkscape:version='1.1%20(c4e8f9ed74,%202021-05-24)'%20sodipodi:docname='OBALogoSingle2.svg'%20xmlns:inkscape='http://www.inkscape.org/namespaces/inkscape'%20xmlns:sodipodi='http://sodipodi.sourceforge.net/DTD/sodipodi-0.dtd'%20xmlns='http://www.w3.org/2000/svg'%20xmlns:svg='http://www.w3.org/2000/svg'%3e%3csodipodi:namedview%20id='namedview8767'%20pagecolor='%23ffffff'%20bordercolor='%23666666'%20borderopacity='1.0'%20inkscape:pageshadow='2'%20inkscape:pageopacity='0.0'%20inkscape:pagecheckerboard='0'%20inkscape:document-units='mm'%20showgrid='false'%20fit-margin-top='0'%20fit-margin-left='0'%20fit-margin-right='0'%20fit-margin-bottom='0'%20inkscape:zoom='1.1759259'%20inkscape:cx='179.85827'%20inkscape:cy='102.04724'%20inkscape:window-width='1920'%20inkscape:window-height='972'%20inkscape:window-x='0'%20inkscape:window-y='27'%20inkscape:window-maximized='1'%20inkscape:current-layer='layer1'%20/%3e%3cdefs%20id='defs8762'%20/%3e%3cg%20inkscape:label='Layer%201'%20inkscape:groupmode='layer'%20id='layer1'%20transform='translate(-31.351095,-50.101677)'%3e%3cpath%20style='fill:none;stroke:%233584e4;stroke-width:3.965;stroke-linecap:square;stroke-linejoin:round;stroke-miterlimit:4;stroke-dasharray:none;stroke-opacity:1'%20d='m%2077.07508,77.78787%2014.84134,8.87817%20V%2052.83397%20L%2034.08359,86.5521%20V%2053.69366%20l%2015.27351,9.31107'%20id='path8388'%20sodipodi:nodetypes='cccccc'%20/%3e%3c/g%3e%3c/svg%3e)
What Is a Financial Analytics Dashboard? A UK Guide
A financial analytics dashboard consolidates portfolio data, market metrics, and performance insights into one visual interface. This guide explains what these dashboards do, what features matter most, and which financial analytics dashboard tools are best suited to different types of investors.
On this page (18)
If you've ever tried to make sense of a portfolio scattered across multiple brokerage accounts, earnings reports, and market data feeds, you already understand the problem that a financial analytics dashboard is designed to solve. Rather than toggling between spreadsheets, news terminals, and broker portals, a well-built dashboard pulls all of that information into a single, unified view — giving investors a clearer picture of what's happening, why it's happening, and what it might mean for their holdings. As data has become central to modern investing, financial analytics dashboard tools have evolved from simple portfolio trackers into sophisticated platforms capable of visualizing complex metrics in real time. This guide explains what these dashboards actually are, what separates a useful one from a cluttered one, and which tools are worth your attention.
What Is a Financial Analytics Dashboard?
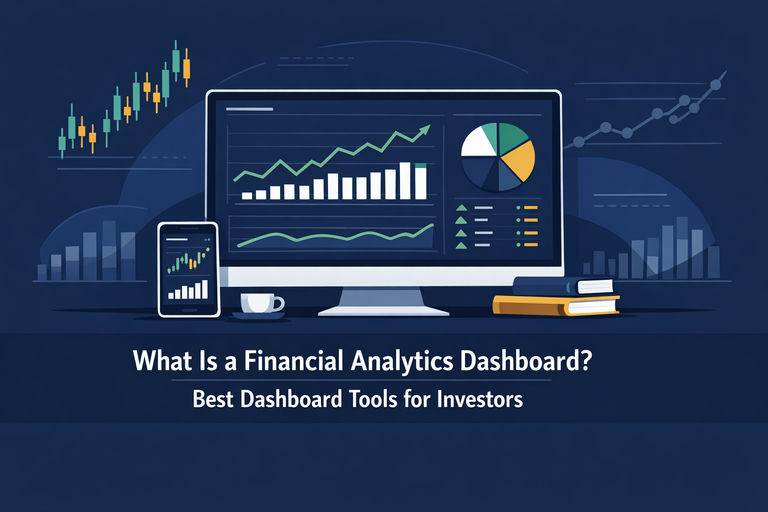
A financial analytics dashboard is a visual interface that aggregates, organizes, and displays financial data in a way that makes it easier to interpret and act on. Think of it as a control panel for your investments — one that translates raw numbers into charts, graphs, trend lines, and performance summaries.
At its core, a financial analytics dashboard serves three functions:
- Data aggregation: It pulls information from multiple sources — brokerage accounts, market data providers, financial statements, and economic indicators — into one place.
- Visualization: It presents that data in formats that are easier to read than rows of numbers, such as candlestick charts, heat maps, performance curves, and allocation pie charts.
- Monitoring: It allows investors to track key metrics over time, set benchmarks, and identify trends or anomalies that might warrant closer attention.
It's worth distinguishing a financial analytics dashboard from a simple portfolio tracker. A basic tracker tells you what you own and what it's currently worth. A true analytics dashboard goes further — it contextualizes performance, compares holdings against benchmarks, surfaces risk metrics, and often integrates fundamental or technical data to support deeper analysis.
Key Components of a Useful Financial Dashboard
Not all dashboards are created equal. The most effective ones share a set of core components that make them genuinely useful rather than just visually impressive.
Portfolio Performance Overview
This is the foundation. A good dashboard shows total portfolio value, returns over multiple time horizons (daily, monthly, year-to-date, since inception), and how those returns compare to a relevant benchmark such as the S&P 500 or a sector index. Without this context, raw return numbers are difficult to evaluate.
Asset Allocation Breakdown
Understanding how your capital is distributed across asset classes, sectors, and geographies is essential for assessing risk. A strong financial analytics dashboard makes this visible at a glance — often through interactive charts that let you drill down into individual positions.
Risk Metrics
Sophisticated dashboards surface metrics like volatility, beta, Sharpe ratio, and maximum drawdown. These numbers help investors understand not just how much a portfolio has returned, but how much risk was taken to generate those returns — a distinction that matters enormously over time.
Fundamental and Market Data Integration
The best tools don't just show you price history. They integrate earnings data, valuation ratios like price-to-earnings (P/E) and price-to-book (P/B), revenue trends, and analyst estimates — giving investors the context needed to evaluate whether a position still makes sense at its current price.
Customizable Alerts and Watchlists
A dashboard that requires you to log in and manually check every metric defeats part of its purpose. Configurable alerts — for price movements, earnings releases, or threshold breaches on key metrics — keep investors informed without demanding constant attention.
Who Benefits Most from Financial Analytics Dashboard Tools?
The short answer is: almost any investor who takes a data-informed approach to managing their money. But the specific benefits vary depending on how you invest.
Long-term, fundamentals-focused investors benefit from dashboards that surface valuation trends, earnings growth trajectories, and dividend history. Being able to see how a company like Microsoft (MSFT) or Johnson & Johnson (JNJ) has evolved across multiple financial metrics over several years is far more efficient through a well-designed dashboard than through manual research.
Active traders lean more heavily on real-time price data, technical indicators, and volume analysis — features that platforms like TradingView are specifically built to deliver.
Portfolio managers and serious DIY investors managing diversified holdings across multiple accounts benefit most from dashboards that consolidate everything in one place, with robust performance attribution and risk analysis tools.
The common thread is this: a financial analytics dashboard reduces the friction between having data and understanding it. That efficiency compounds over time, leading to more informed decisions and fewer costly oversights.
Best Financial Analytics Dashboard Tools for Investors
The landscape of financial analytics dashboard tools has expanded significantly. Here is a breakdown of the most notable options, each suited to different investor needs.
TradingView
TradingView is one of the most widely used platforms among active investors and traders. Its charting capabilities are exceptional — offering over 100 built-in technical indicators, multiple chart types, and the ability to view several charts simultaneously. The platform also has a large community of users who share custom indicators and trading ideas. TradingView is particularly strong for technical analysis and real-time market monitoring. Its free tier is functional but limited; the more powerful features require a paid subscription. It is best suited to investors who prioritize chart-based analysis and market visualization.
Microsoft Power BI
Power BI is a general-purpose business intelligence tool from Microsoft (MSFT) that can be configured into a powerful financial analytics dashboard. It connects to a wide range of data sources and offers highly customizable visualizations. For investors or analysts comfortable with data modeling, Power BI can be built into a bespoke dashboard that tracks exactly the metrics that matter to them. The trade-off is that it requires more setup time and technical knowledge than purpose-built investment tools.
Sharesight
Sharesight is a portfolio tracking and performance reporting tool designed specifically for investors. It handles multi-currency portfolios, automatically accounts for dividends and corporate actions, and produces detailed performance reports that include tax calculations in several jurisdictions. Its benchmark comparison features are particularly strong, making it easy to see whether your portfolio is keeping pace with relevant indices. Sharesight is a solid choice for long-term investors who want accurate, comprehensive performance reporting without building their own system.
Morningstar Investor
Morningstar has long been a trusted name in investment research, and its Investor platform brings that depth of data into a dashboard format. Users get access to Morningstar's proprietary ratings, analyst reports, valuation estimates, and portfolio X-ray tool — which breaks down a portfolio's underlying exposure to sectors, asset classes, and individual securities. For fundamentals-focused investors who want research depth alongside portfolio monitoring, Morningstar Investor is one of the most comprehensive options available.
Koyfin
Koyfin has gained a strong following among serious retail investors and financial professionals who want institutional-grade data without the institutional price tag. The platform offers detailed financial statement analysis, earnings estimates, macroeconomic data, and customizable dashboards that can be tailored to specific investment workflows. Its charting and data visualization tools are notably strong, and the breadth of data available — covering equities, ETFs, fixed income, and macro indicators — makes it a versatile choice for investors who want a single platform for research and monitoring.
Personal Capital (Empower)
Now operating under the Empower brand, this platform is geared toward investors who want a holistic view of their financial picture — including investment accounts, bank accounts, and retirement projections. Its dashboard is clean and accessible, with useful tools for tracking net worth, analyzing investment fees, and projecting retirement readiness. It is less focused on deep market analytics and more on personal financial management, making it a strong choice for investors who want a high-level overview rather than granular market data.
What to Look for When Choosing a Financial Analytics Dashboard
With so many tools available, the right choice depends on your specific investing style and what you actually need from a dashboard. Here are the key factors to evaluate:
- Data depth: Does the platform provide the level of financial data you need — real-time prices, historical fundamentals, earnings estimates, macro indicators?
- Customization: Can you configure the dashboard to show the metrics that matter most to your strategy, or are you locked into a fixed layout?
- Integration: Does it connect to your brokerage accounts and data sources, or will you need to enter data manually?
- Ease of use: A dashboard that requires significant technical expertise to operate will go unused. The best tools balance power with accessibility.
- Reliability and data accuracy: Financial decisions depend on accurate data. Check whether the platform has a track record of reliable data feeds and minimal downtime.
- Cost relative to value: Free tools can be excellent starting points, but premium features often justify their cost for serious investors. Evaluate what you actually need before committing to a paid plan.
The Role of a Dashboard in a Broader Investment Process
It's important to frame a financial analytics dashboard correctly: it is a tool for organizing and interpreting information, not a substitute for sound investment judgment. A dashboard can show you that a stock's valuation has expanded significantly over the past year, but it cannot tell you whether that expansion is justified by the company's growth prospects. That judgment still requires analysis, context, and a clear investment thesis.
What a good dashboard does is reduce the time and effort required to stay on top of your portfolio, surface information that might otherwise be missed, and present data in a format that makes patterns and anomalies easier to spot. Used well, it becomes an extension of your investment process — not a replacement for it.
The most effective investors tend to use dashboards as a first layer of monitoring, flagging situations that warrant deeper research rather than triggering decisions on their own. That discipline — using data to ask better questions rather than to shortcut the thinking — is what separates informed investing from reactive investing.
Conclusion
A financial analytics dashboard is one of the most practical tools an investor can add to their workflow. By consolidating data, visualizing performance, and surfacing key metrics in one place, the right dashboard saves time, reduces blind spots, and supports more consistent decision-making. Whether you are a long-term investor monitoring a diversified portfolio or an active trader tracking real-time market movements, there is a tool designed to match your needs. The key is to choose one that aligns with your investing style, integrates with your existing data sources, and presents information in a way that genuinely helps you think more clearly — not just one that looks impressive on screen.
You can Compare MSFT, JNJ side by side on Openbook, or find stocks with the screener.