%20--%3e%3csvg%20width='63.297821mm'%20height='39.29665mm'%20viewBox='0%200%2063.297821%2039.29665'%20version='1.1'%20id='svg8765'%20inkscape:version='1.1%20(c4e8f9ed74,%202021-05-24)'%20sodipodi:docname='OBALogoSingle2.svg'%20xmlns:inkscape='http://www.inkscape.org/namespaces/inkscape'%20xmlns:sodipodi='http://sodipodi.sourceforge.net/DTD/sodipodi-0.dtd'%20xmlns='http://www.w3.org/2000/svg'%20xmlns:svg='http://www.w3.org/2000/svg'%3e%3csodipodi:namedview%20id='namedview8767'%20pagecolor='%23ffffff'%20bordercolor='%23666666'%20borderopacity='1.0'%20inkscape:pageshadow='2'%20inkscape:pageopacity='0.0'%20inkscape:pagecheckerboard='0'%20inkscape:document-units='mm'%20showgrid='false'%20fit-margin-top='0'%20fit-margin-left='0'%20fit-margin-right='0'%20fit-margin-bottom='0'%20inkscape:zoom='1.1759259'%20inkscape:cx='179.85827'%20inkscape:cy='102.04724'%20inkscape:window-width='1920'%20inkscape:window-height='972'%20inkscape:window-x='0'%20inkscape:window-y='27'%20inkscape:window-maximized='1'%20inkscape:current-layer='layer1'%20/%3e%3cdefs%20id='defs8762'%20/%3e%3cg%20inkscape:label='Layer%201'%20inkscape:groupmode='layer'%20id='layer1'%20transform='translate(-31.351095,-50.101677)'%3e%3cpath%20style='fill:none;stroke:%233584e4;stroke-width:3.965;stroke-linecap:square;stroke-linejoin:round;stroke-miterlimit:4;stroke-dasharray:none;stroke-opacity:1'%20d='m%2077.07508,77.78787%2014.84134,8.87817%20V%2052.83397%20L%2034.08359,86.5521%20V%2053.69366%20l%2015.27351,9.31107'%20id='path8388'%20sodipodi:nodetypes='cccccc'%20/%3e%3c/g%3e%3c/svg%3e)
Micron (MU) stock analysis 2026 produces a result that will annoy both camps. The company has just posted the most profitable quarter in the history of the memory industry, and the Openbook model rates it a moderate 60 out of 100 on Reward with a high 72 on Risk. That is not a rounding error. It is the distance between what happened in one quarter and what shows up in three years of financial statements. Momentum scores 83. Growth scores 48. Everything worth knowing about this share sits in the gap between those two numbers, and in July 2026 the market started arguing about which one is right.
What Micron actually does
Micron makes DRAM and NAND memory, the commodity building blocks inside every server, phone, car and PC, sold to manufacturers directly and to consumers under the Crucial brand. The product that rewrote the story is high bandwidth memory, the stacked DRAM that feeds AI accelerators, and Micron has said its output is committed for calendar 2026. Data centre revenue passed $25bn in the May quarter alone, an annualised run rate above $100bn, and the company crossed a trillion dollars of market value in May. UK investors can hold the shares in an ISA or a SIPP through most platforms after filing a W-8BEN. Every score quoted below is published, and updates, on the Openbook MU equity page.
Reward Score, the read
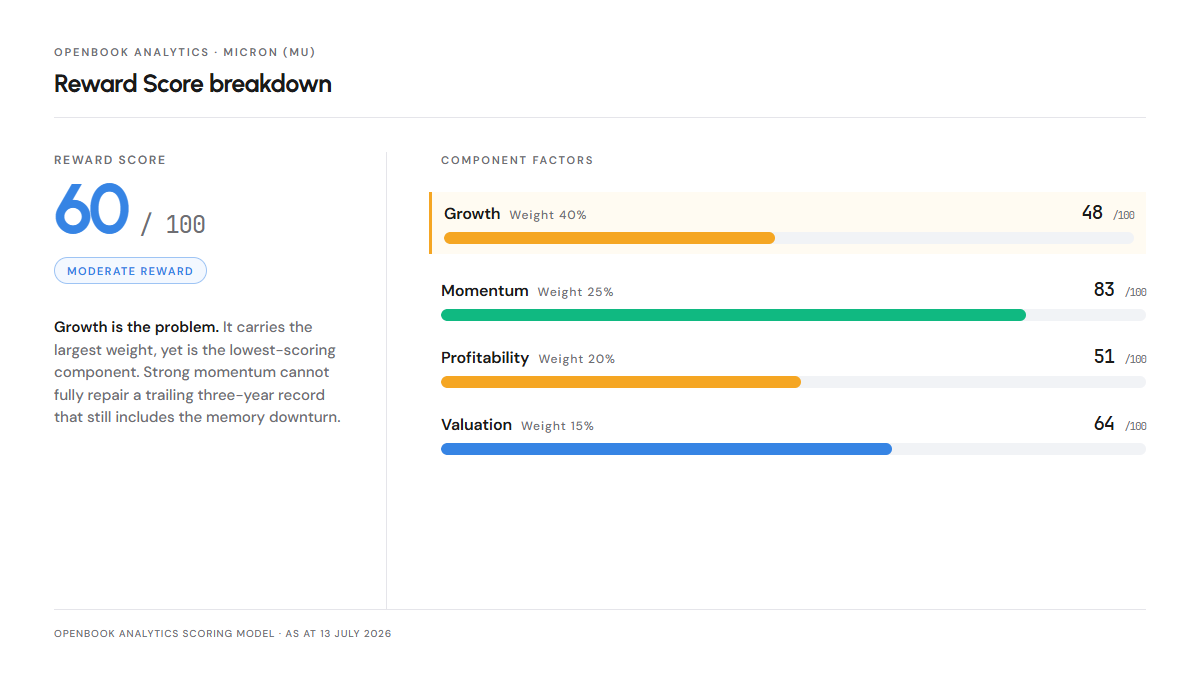
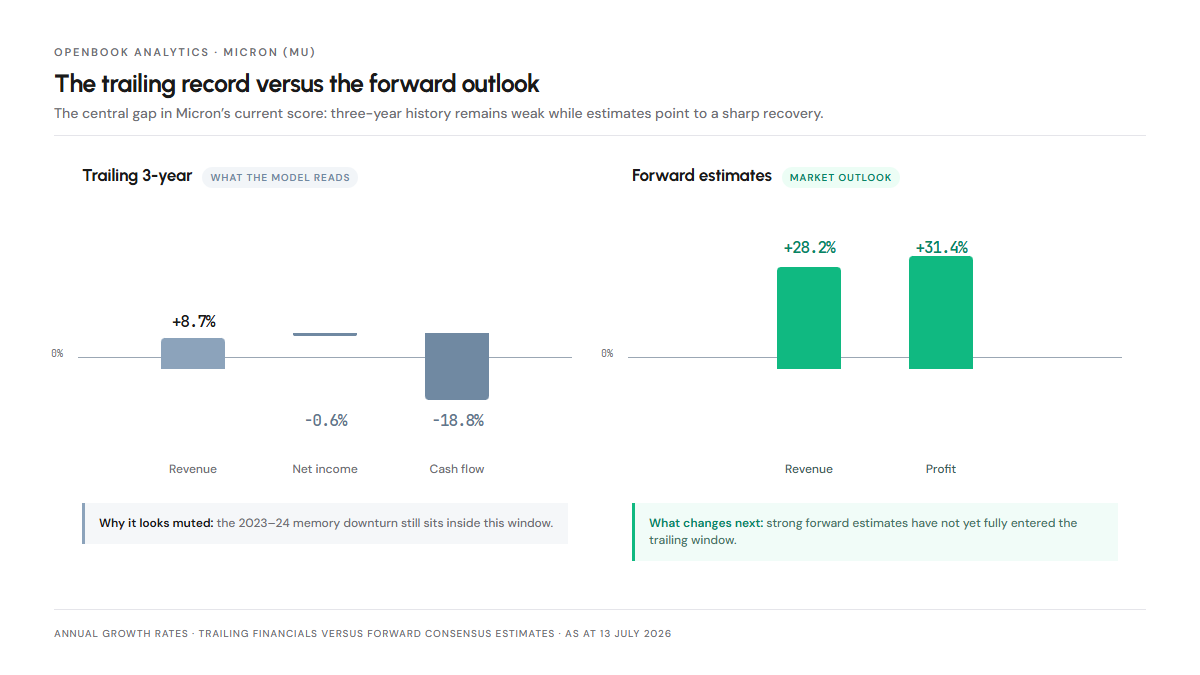
Growth carries the heaviest weight at 40% and scores just 48, which is the most important line in this report. The trailing three year window still contains the last memory downturn, so it shows revenue growth of 8.7% a year, net income growth of minus 0.6% and cash flow growth of minus 18.8%. Forward estimates are scored separately and are far stronger, at 28.2% revenue growth and 31.4% profit growth. Fiscal Q3 revenue of $41.5bn, up 346% on the year, is not yet inside the history the factor reads.
Momentum takes 25% and scores 83, the strongest factor by a wide margin. Price momentum runs 679.3% ahead of the FTSE 100 over twelve months and 186.4% ahead over six, with a three month return of 123.8%. The soft spot is return consistency, flagged as failing. The gains arrived in bursts, and July proved the point. Samsung reported a record operating profit and the market sold the entire memory complex anyway, pushing the group more than 20% below its highs.
Profitability weighs 20% and scores 51, which will surprise anyone reading the headlines. Return on equity of 22.6% and return on assets of 10.9% both score Very Good. But the trailing gross margin of 38.8% sits below the sector average, cash conversion of 20% is flagged Bad, and three year operating profit growth is 1.6%. The 84.9% gross margin and 81.2% operating margin currently being quoted belong to a single quarter. The factor is scoring the average of a cycle.
Valuation carries 15% and scores 64. A PEG of 0.16, a forward P/E of 12.2x and a debt load of 0.2x all register as relative value. The rest of the same panel says the opposite: 288x price to cash flow and 9.4x price to revenue, a premium on both. That contradiction is not a modelling error. It is what a stock looks like when the earnings in the denominator sit at a cyclical peak.
Risk Score, the read
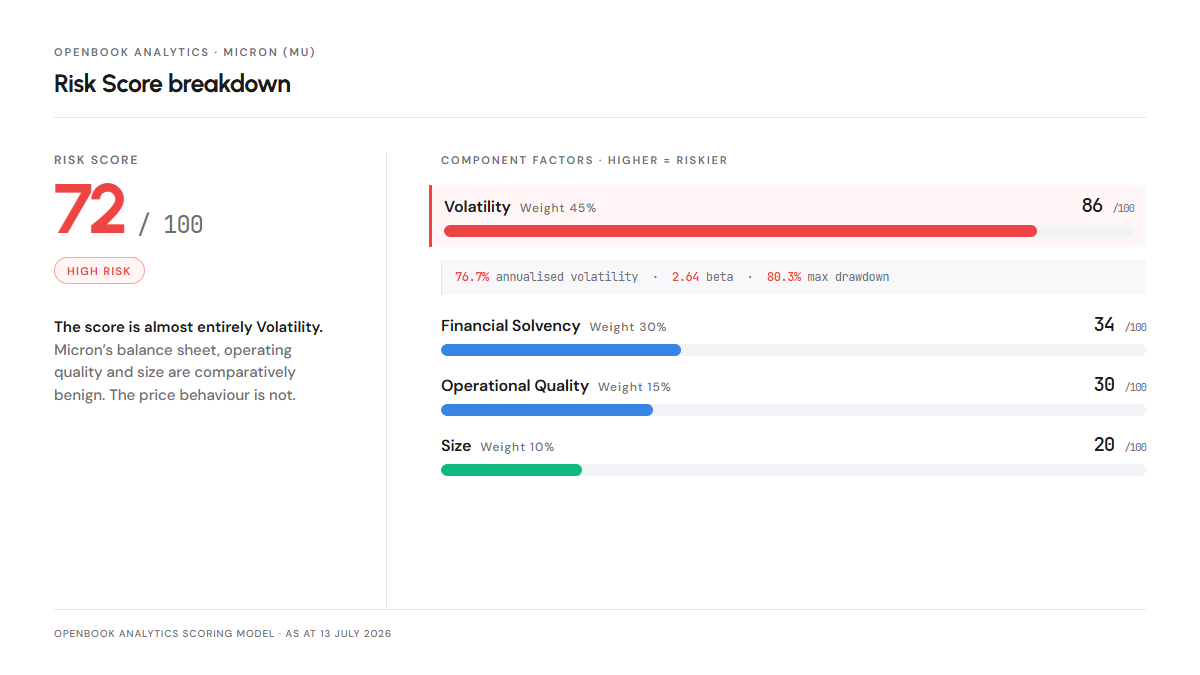
The Risk Score of 72 places Micron in the high band, and its composition is lopsided. Financial Solvency scores 34, with interest cover of 21.2x, net debt to EBITDA of 0.2x and a current ratio of 3.62x. Micron cut debt by $4.4bn in the May quarter, to $5.7bn, and holds over $30bn in cash and investments. Operational Quality scores 30. Size scores 20. None of that is where the danger sits.
Volatility carries 45% of the risk weight and scores 86. Annualised volatility of 76.7% is flagged extreme, the beta of 2.64 as very aggressive, and the historical maximum drawdown is 80.3%. The last three weeks are the live demonstration. Semiconductor stocks shed roughly $1.5trn of market value in the seven trading days after 25 June, and Micron alone accounted for close to $350bn of it. One further line deserves attention: the three year debt trend is up 850% and flagged as rapidly deteriorating, even though absolute leverage is trivial. Micron has committed more than $250bn to US fabs through 2035. The balance sheet is strong today because the profits are extraordinary today.
What the market is missing
Most Micron stock analysis in 2026 has split into supercycle believers and cycle bears, and both are arguing about the size of the earnings. The scores describe something else: a moderate expected reward attached to an extremely wide range of outcomes. Micron has signed 16 take-or-pay Strategic Customer Agreements running to 2030, with roughly $100bn of remaining performance obligations and $22bn of customer cash deposits and letters of credit behind them. Each carries a price ceiling near current levels and a floor that management says still clears margins above any previous industry peak. That does not abolish the cycle. It changes its shape. Around 40% of revenue eventually sits on a contractual floor, and the remaining 60% stays exposed to spot pricing when the industry's new capacity, Micron's own fabs included, arrives in 2027 and 2028. The bear case that follows is not a collapse into losses. It is a company still earning enormous money while its growth rate turns negative, and a market paying a much lower multiple for that.
Where the data points next
Any Micron (MU) stock analysis in 2026 comes back to the Growth score of 48, because its repair is mechanical. As the boom quarters roll into the trailing three year window and the downturn quarters roll out, the factor rises without anything new happening at the company. Whether the price has already paid for that repair is the question every holder is answering for themselves, and SK Hynix's $26.5bn Nasdaq listing on 10 July has just given US capital another way to answer it. The figure to test it against is gross margin in the fiscal Q4 print expected in late September, guided to around 86%. The live MU scores move as the model does, before and after that print, and the comparison tool and screener are there for anyone who wants to see how the rest of the sector scores on the same basis. For the wider theme Micron sits inside — accelerators, semi-cap equipment, memory and networking — the AI Infrastructure & Semiconductors collection groups the names on the same scoring basis; the more speculative end of the compute build-out sits in the Quantum Computing collection.
Discussion
Log in to join the discussion